I was looking at The Fresh Loaf traffic stats in the newest version of Google Analytics today and, I gotta say, I've never seen charts like these. For example, here is a visitor report for a typical website:

Weekend traffic is lower. Tuesday, Wednesday, and Thursday have the highest traffic because most people are in the office those days and most web surfing, even if it is for pleasure, happens while people are at the office.
There is a similar curve throughout the day, with the highest traffic on most sites being between 10-2 PM Pacific Time, when people on both the east and west coasts of the US are in the office. Traffic from Europe and Asia can, obviously, impact how much off hours traffic you have, but I've never seen a US-based website whose traffic that didn't peak in the middle of the business day here.
Here is my chart for the past month.

The spike at the end is when StumbleUpon featured The Fresh Loaf. I think the dip on the 7th was when my server was acting up. Otherwise, it is almost a straight line. Traffic is higher around the holidays, but overall my traffic is extremely constant, with about 65% of traffic coming from new users and 35% from returning visitors.
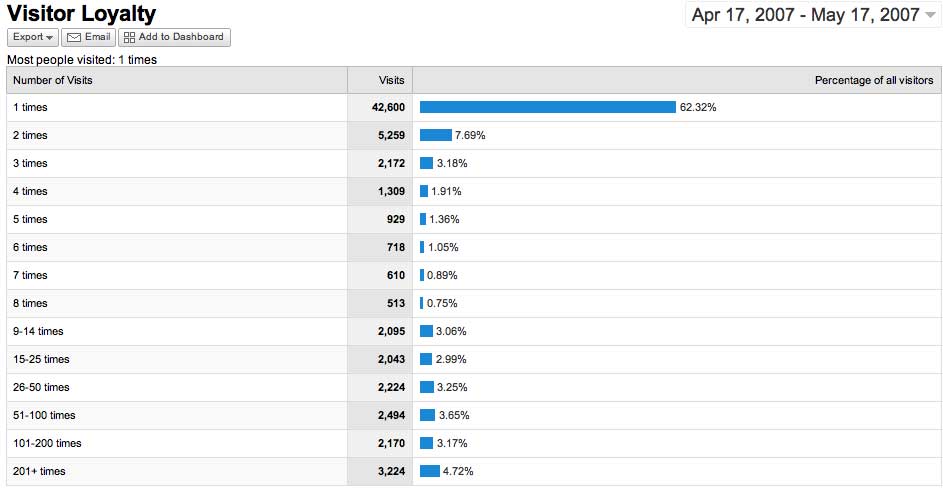
What is really unusual is the visitor loyalty report:

When people return to The Fresh Loaf, they return. A lot. That almost 20 percent of my traffic has been to the site more than 9 times in the last month and that almost 5 percent has been here over 200 times is unheard of. I've never seen stats like that. This just reinforces my sense that you guys are crazy that we have a very enthusiastic community here. People come here and either decide this isn't what they were looking for and go away, or they decide this is exactly what they were looking for, so they come back again and again and again...